CDNetworks Documentation
Retrieving Instances of an Application in List View
- In the left pane, click Applications.
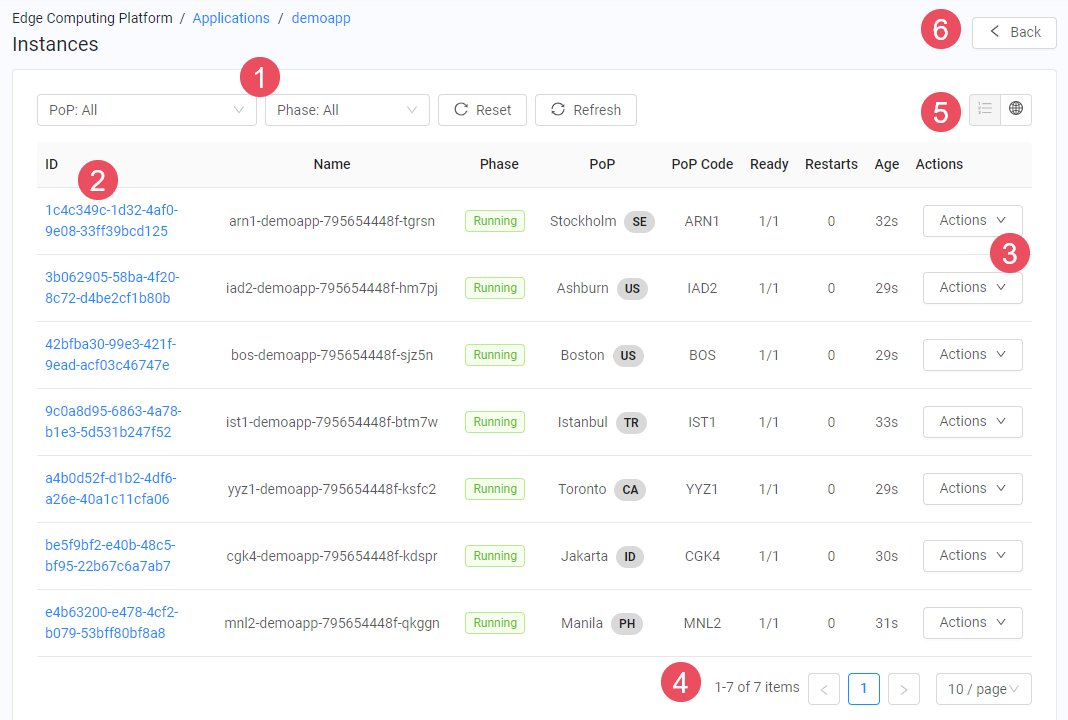
- On the Applications page, click a link below the Instances column. A page similar to the following shows a list view of instance information for the selected application. The table below the figure describes the elements on this page.

| Fields | Description |
|---|---|
| 1 | By default, all instances are shown. Use the PoP and Phase drop-down lists to filter the instances. The two right buttons reset the filters and refresh the instances shown. |
| 2 | Click an ID to view information about an instance. |
| 3 | The Actions drop-down list on each row has options for viewing metrics, viewing logs, and accessing a shell for an instance. |
| 4 | Use these buttons to go to other Instances pages. |
| 5 | Use these icons to toggle between list view (which is the default) and map view. |
| 6 | Click this button to return to the Applications page. |
Retrieving Instances of an Application in Map View
- In the left pane, click Applications.
- On the Applications page, click a link below the Instances column.
- At the top right of the Instances page, click the
 icon.
icon.

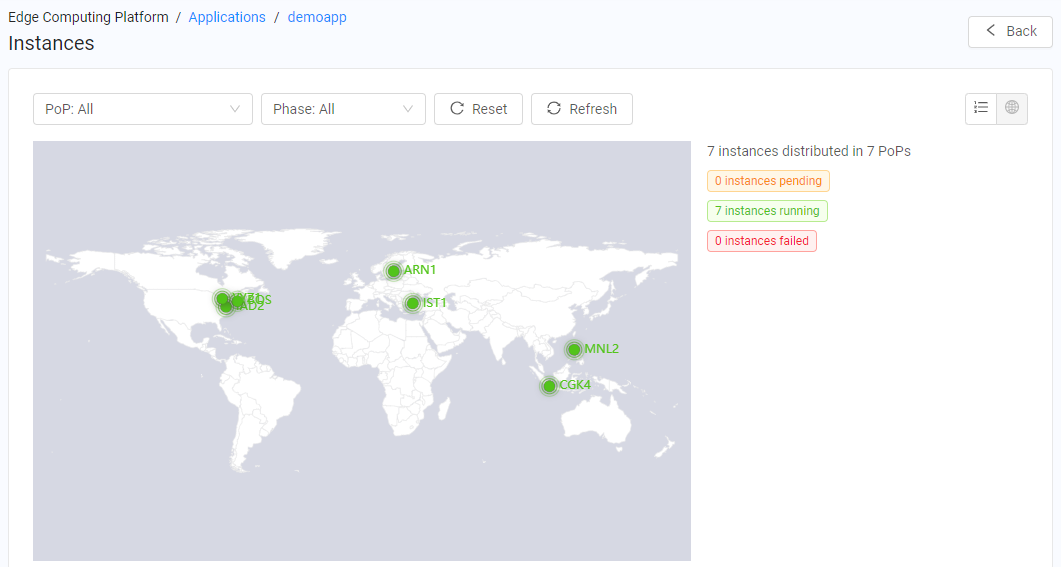
A map view similar to the following shows the location of the instances and their phases.

-
By default, all instances are shown on the map. Using the PoP and Phase drop-down lists above the map, you can filter the instances. The two right buttons next to the drop-down lists reset the filters and refresh the instances shown.
-
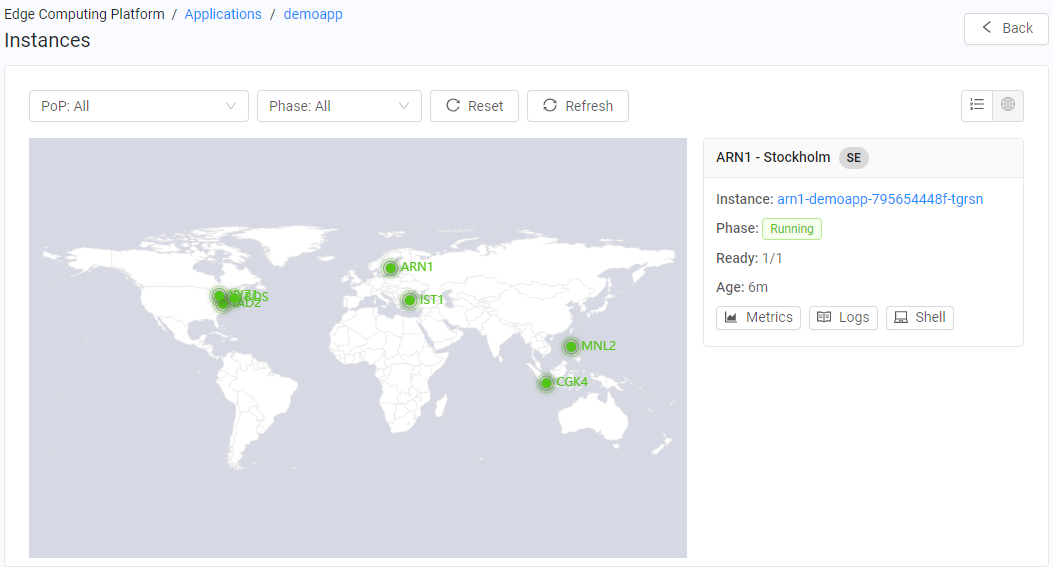
Clicking an Instance displays a popup similar to the following figure with detailed information. Clicking the link next to Instance displays detailed information about that instance, with buttons for viewing metrics, viewing and downloading logs, and running commands inside containers. For an example, see the figure under Viewing Instance Information below.

- To return to the Applications page, click the < Back button at the top right.
Viewing Instance Information
The following procedure describes how to view information about application instances.
- In the left pane, click Applications.
- On the Applications page, click the instance whose information you want to view.
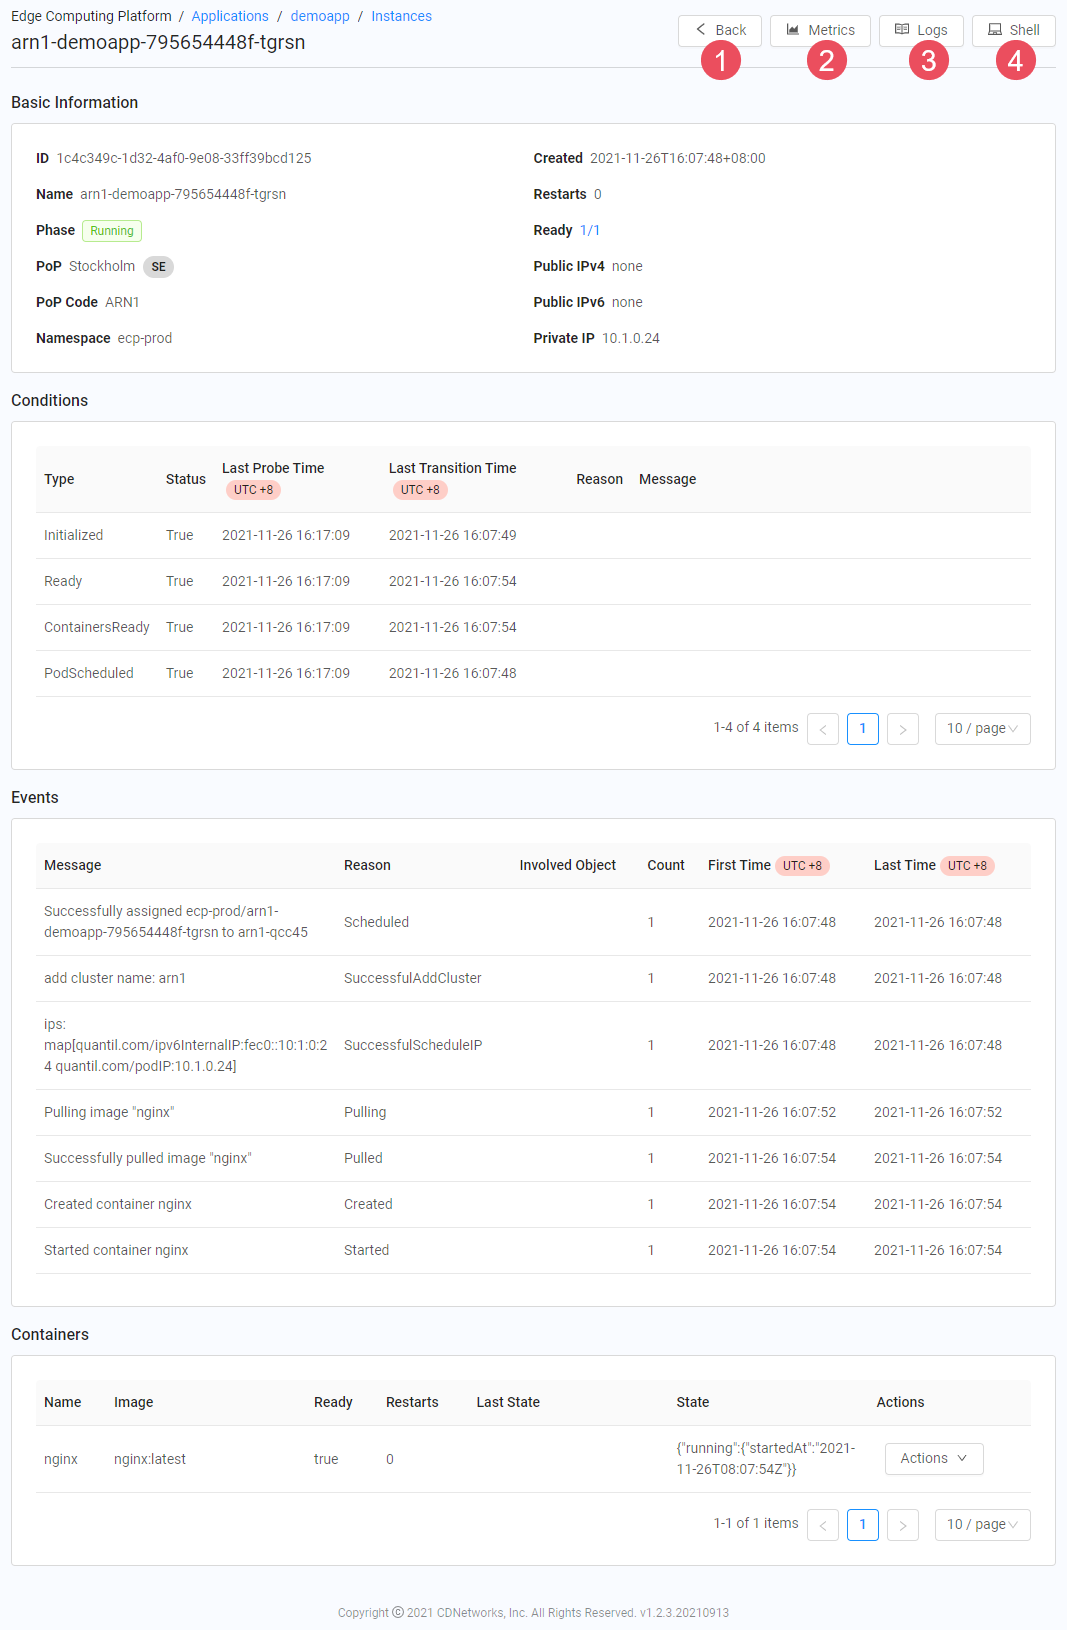
- On the Instances page, click a link below the ID column. A form similar to the following appears. The table below the figure describes the elements on this form.

| Fields | Description |
|---|---|
| 1 | Click this button to return to the Instances page. |
| 2 | Click this button to view metrics such as CPU, memory, traffic, and bandwidth usage in a popup. Controls at the top of the popup allow you to select metrics, interval, date and time, and UTC. |
| 3 | Click this button to obtain a live stream of logs from the instance. |
| 4 | Click this button to run commands inside the instance. |