CDNetworks Documentation
Reports
The ECP reporting feature enables you to retrieve reports on both your resource requests (CPU, RAM, disks, and IP) and real-time traffic data.
You can query reports for up to one year (366 days, which includes Leap Day). The report granularity can be as high as 1-minute or from medium to low, such as 5-minute, hourly, daily, and monthly.
If you are a reseller with child accounts, you can select the accounts that a report will cover (the parent account only, the child accounts only, or both the parent and child accounts).
Reports Page
Reports are generated from the Reports page. To display this page, click Reports in the left pane.
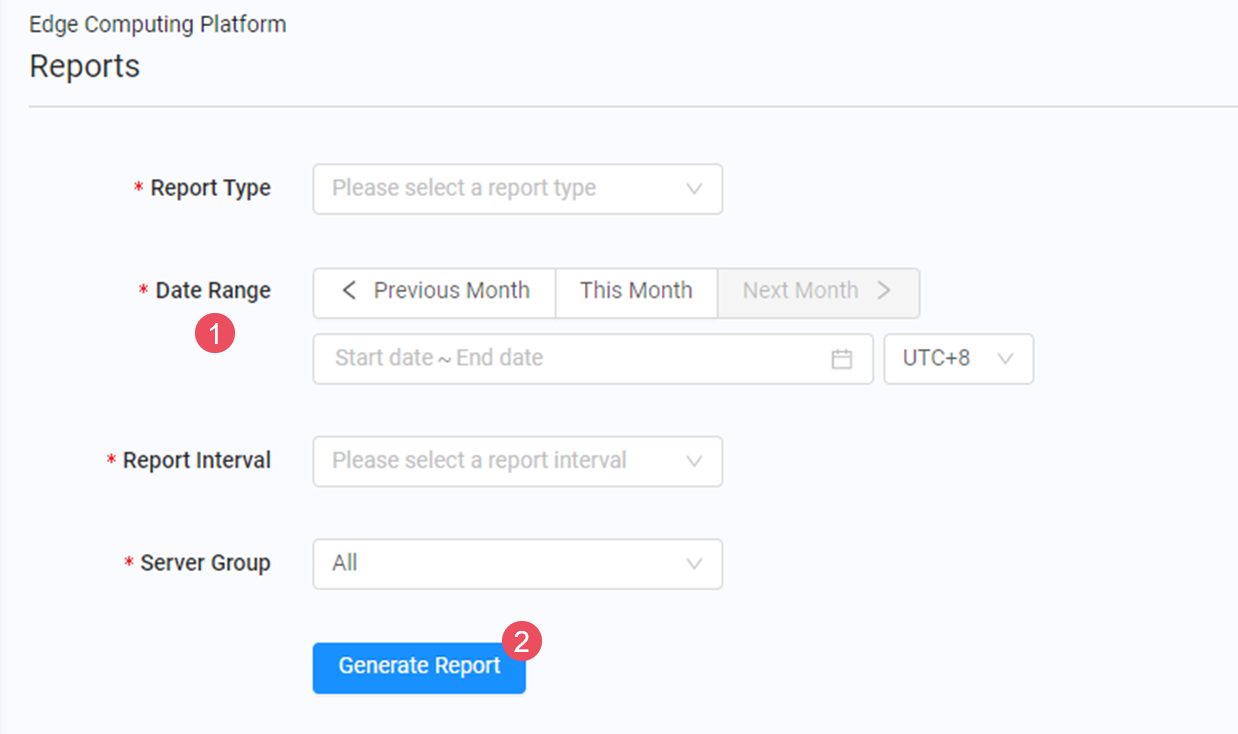
The following figure shows the key elements on the page.
| Fields | Description |
|---|---|
| 1 | Specify the report type, date range, report interval, and server group. Resellers with child accounts can also select a report range. |
| 2 | The Generate Report button allows you to generate the report defined by the report parameters. |
Understanding Report Types
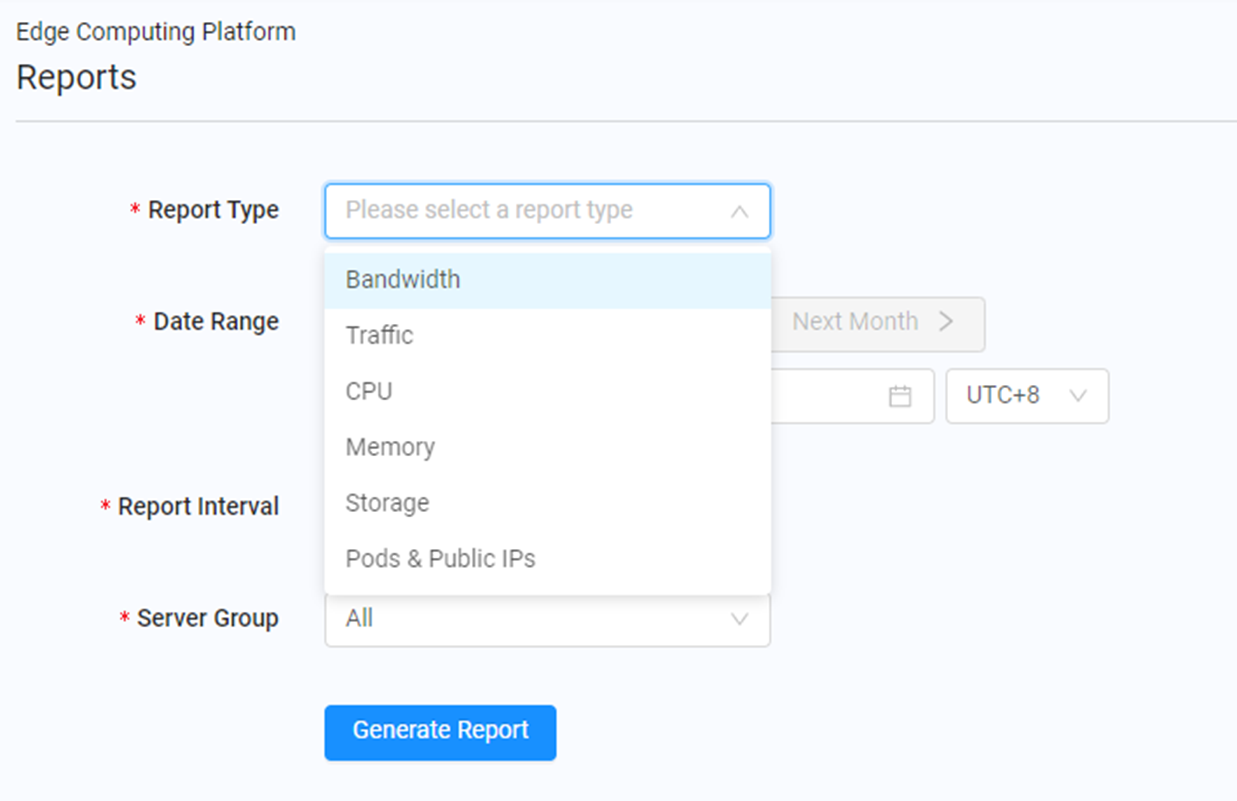
The ECP supports the following type of reports. You select a report type from the Report Type drop-down list on the Reports page.
| Report | Description |
|---|---|
| Bandwidth | Shows 95th percentile bandwidth of incoming/outgoing/total traffic, average bandwidth, and how the bandwidth changes over time. |
| Traffic | Shows volumes of incoming/outgoing/total traffic, and how the volumes change over time. |
| CPU | Shows peak CPU requests and how the requests change over time. |
| Memory | Shows peak RAM requests and how the requests change over time. |
| Storage | Shows peak local-SSD and persist-SSD storage requests, and how the requests change over time. |
| Pods & Public IPs | Shows peak pods and IP addresses requests, and how the requests change over time. |
Generating Reports
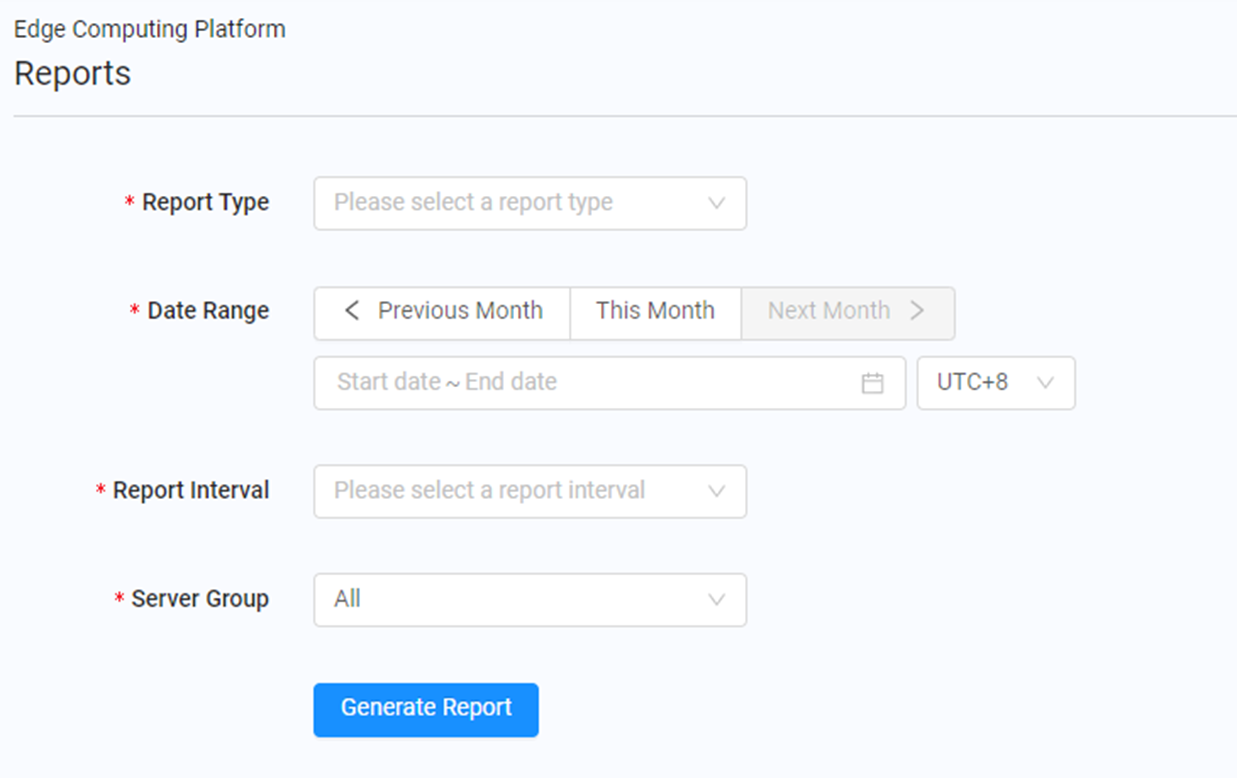
- In the left pane, click Reports.
- Complete the fields in the Reports form. Required fields are denoted by an asterisk (*).
| Fields | Description |
|---|---|
| Report Type | Select the type of report you want to generate. |
| Date Range | Select a start date and an end date, or a preset time span for the report. Use the UTC drop-down list to select a time zone. |
| Report Interval | Select the granularity of the returned data. Choices are:
|
| Server Group | Select one or more server group options.
|
| Report Range | If you are a reseller with child accounts, select the accounts that this report will cover. Choices are:
|
- Click the Generate Report button to generate the report.
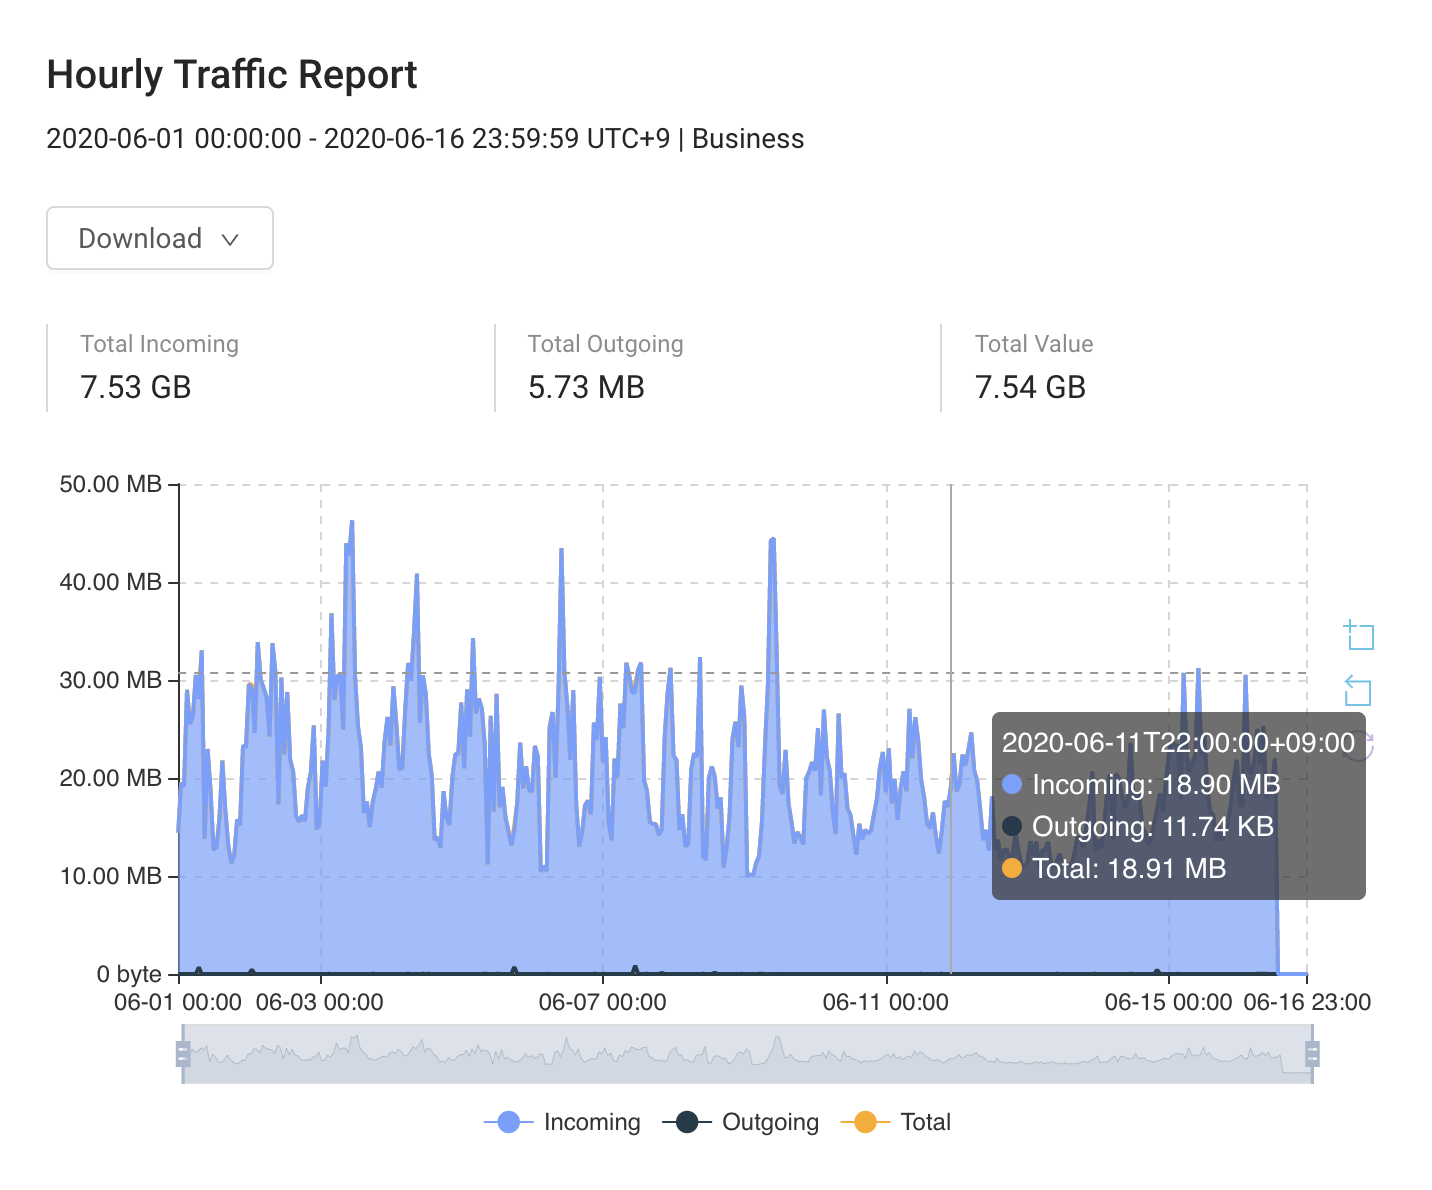
- With a generated report (similar to the one below) displayed at the bottom of the form, you can:
- Hold your cursor over data points in the report to view detailed information.
- Use the icons at the right side of the report to zoom regions, cancel zoom, and reset zoom.
- Use the Download button at the top-right of the report to download the report in JPEG, PNG, and PDF formats.