CDNetworks Documentation
Troubleshooting an Application
Application inspection and debugging is an important part of application lifecycle management. The ECP portal has that covered. Check below the tools available.
Events
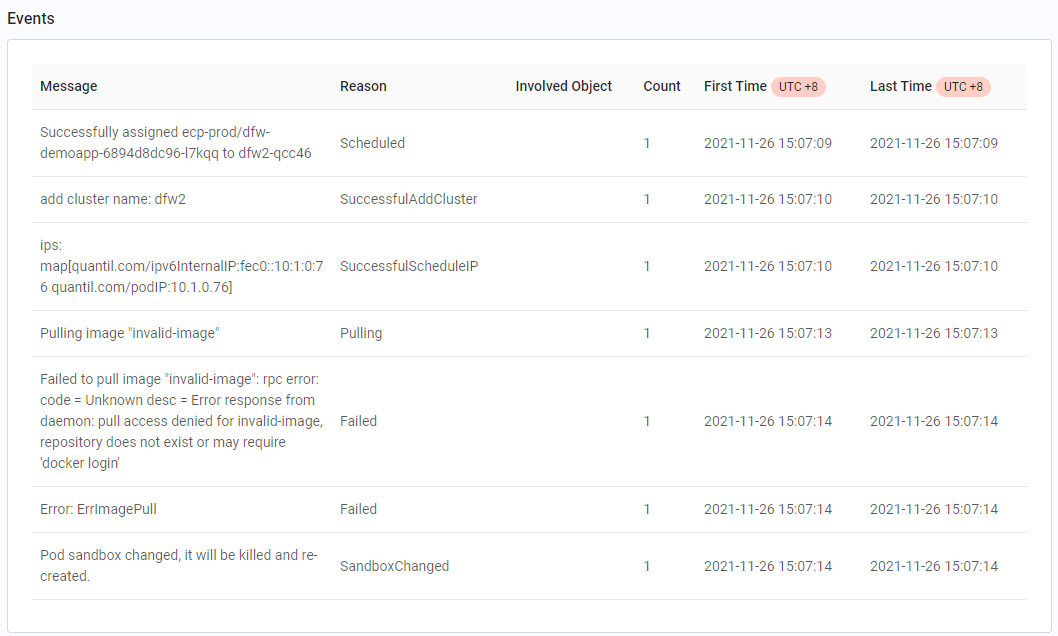
Means events that Kubernetes reports when deploying a pod and when the pod is running inside Kubernetes cluster.
Go to the detail page of a specific application instance (i.e. a pod) and check events reported. You would find helpful debug info there, especially when the instance is stuck in a pending or failed state.
Note: The events are not persistent and are removed 3 hours after the last occurrence.

Logs Viewer
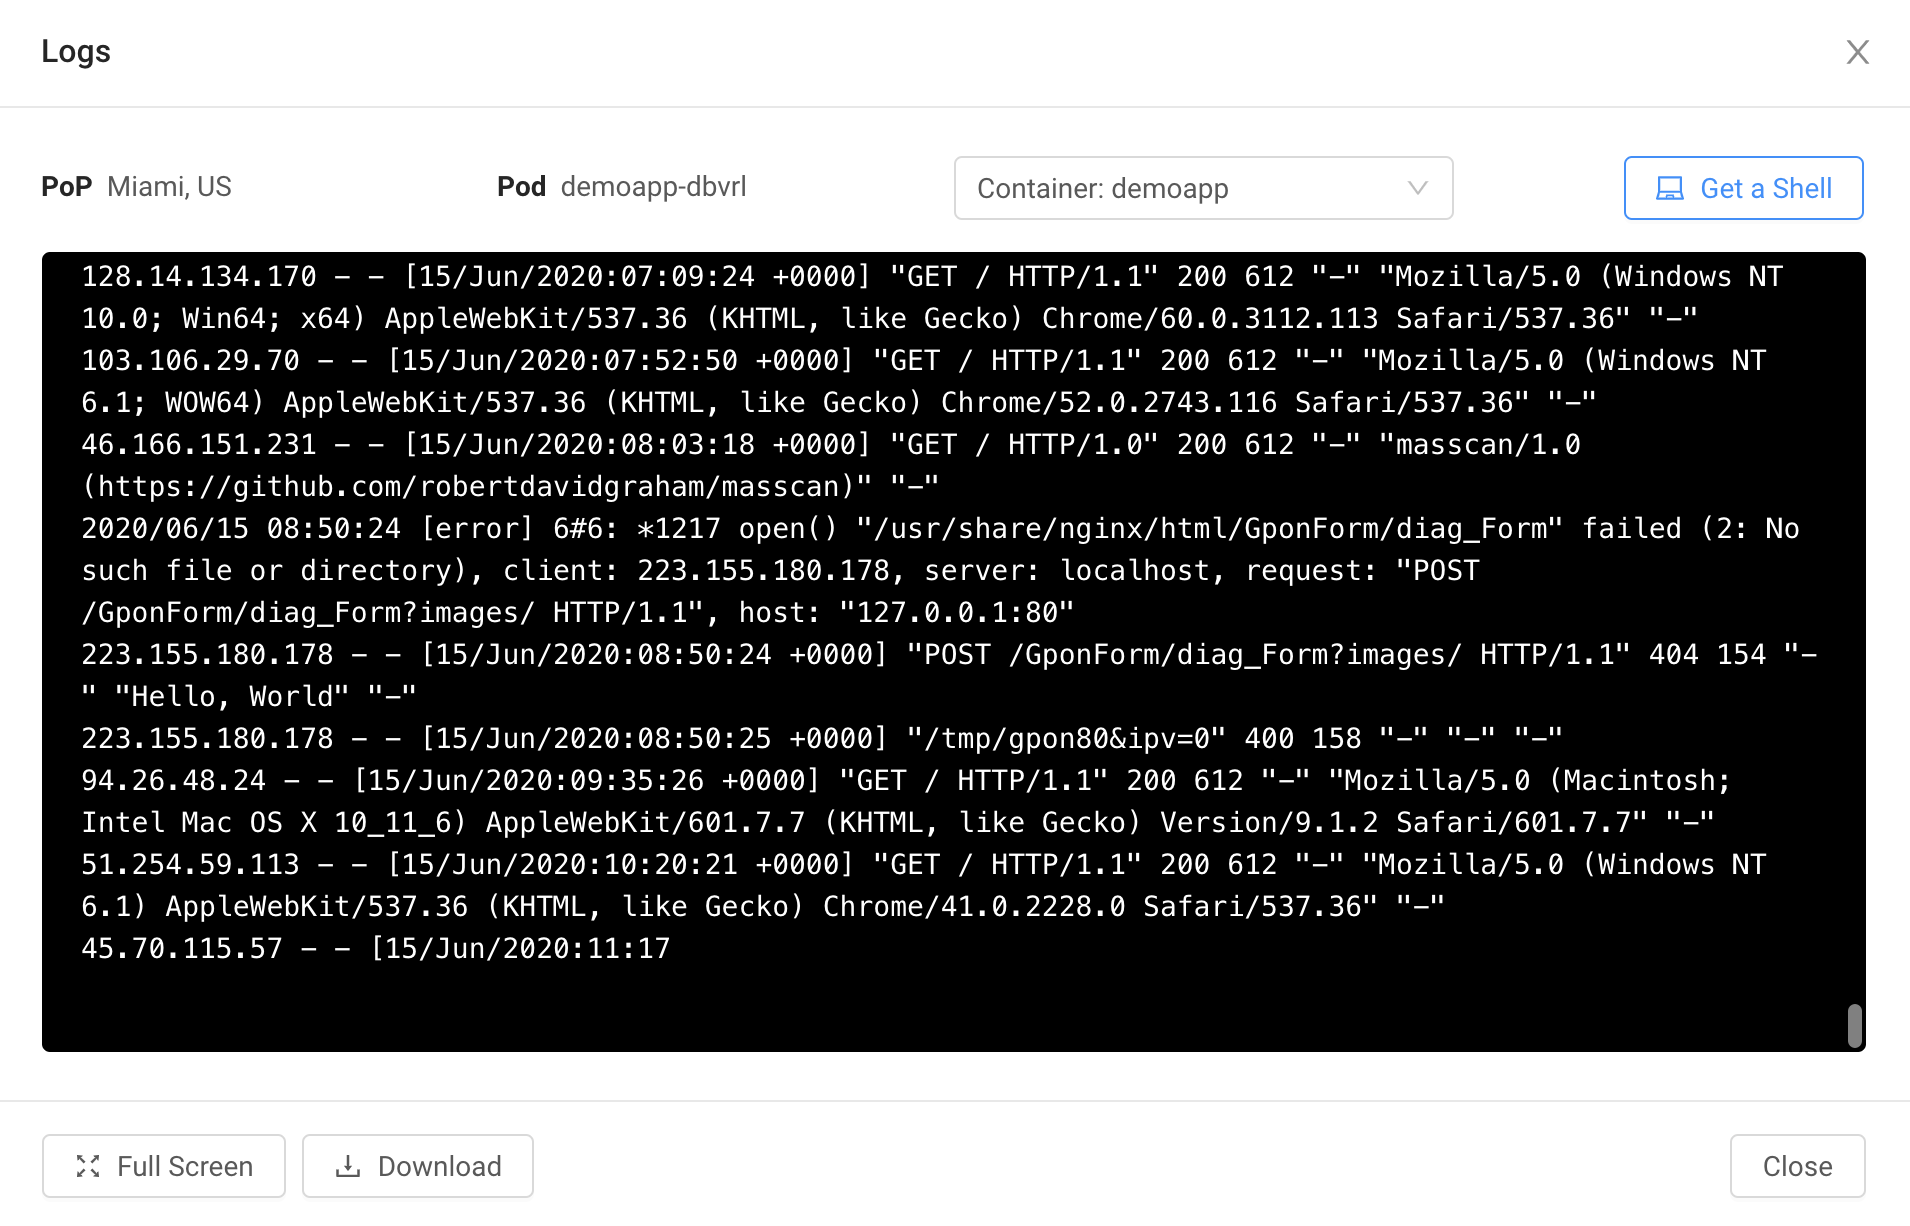
Go to the detail page of a specific application instance, click the top-right Logs button, and obtain a live stream of logs from your container. The output is the same as what you would see when you execute the docker logs command in your own Docker environment.

Cloud Shell
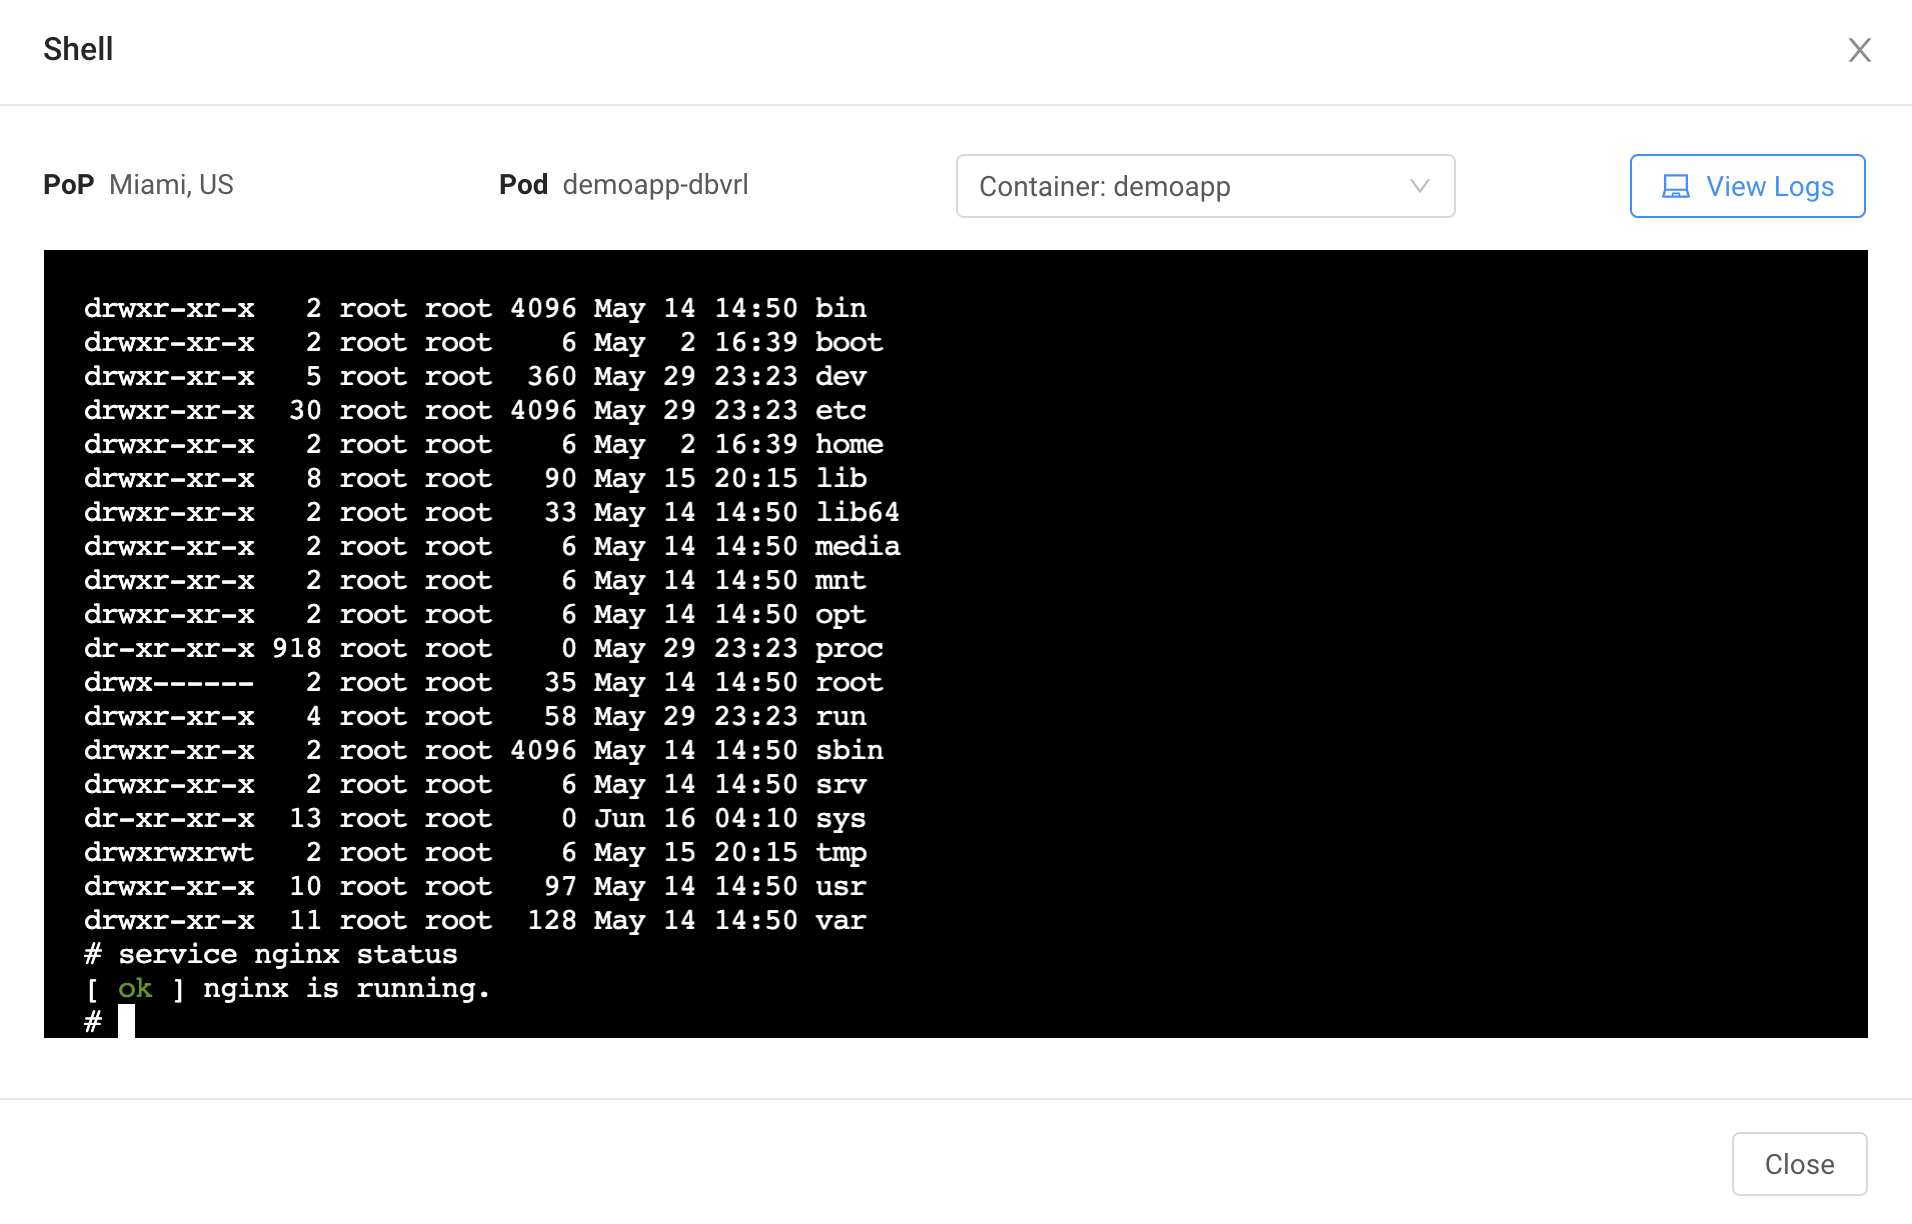
Go to the detail page of a specific application instance, click the top-right Shell button, and open a shell to your container to execute commands there inside. The effect is the same as executing the docker exec command in your own Docker environment.

Metrics
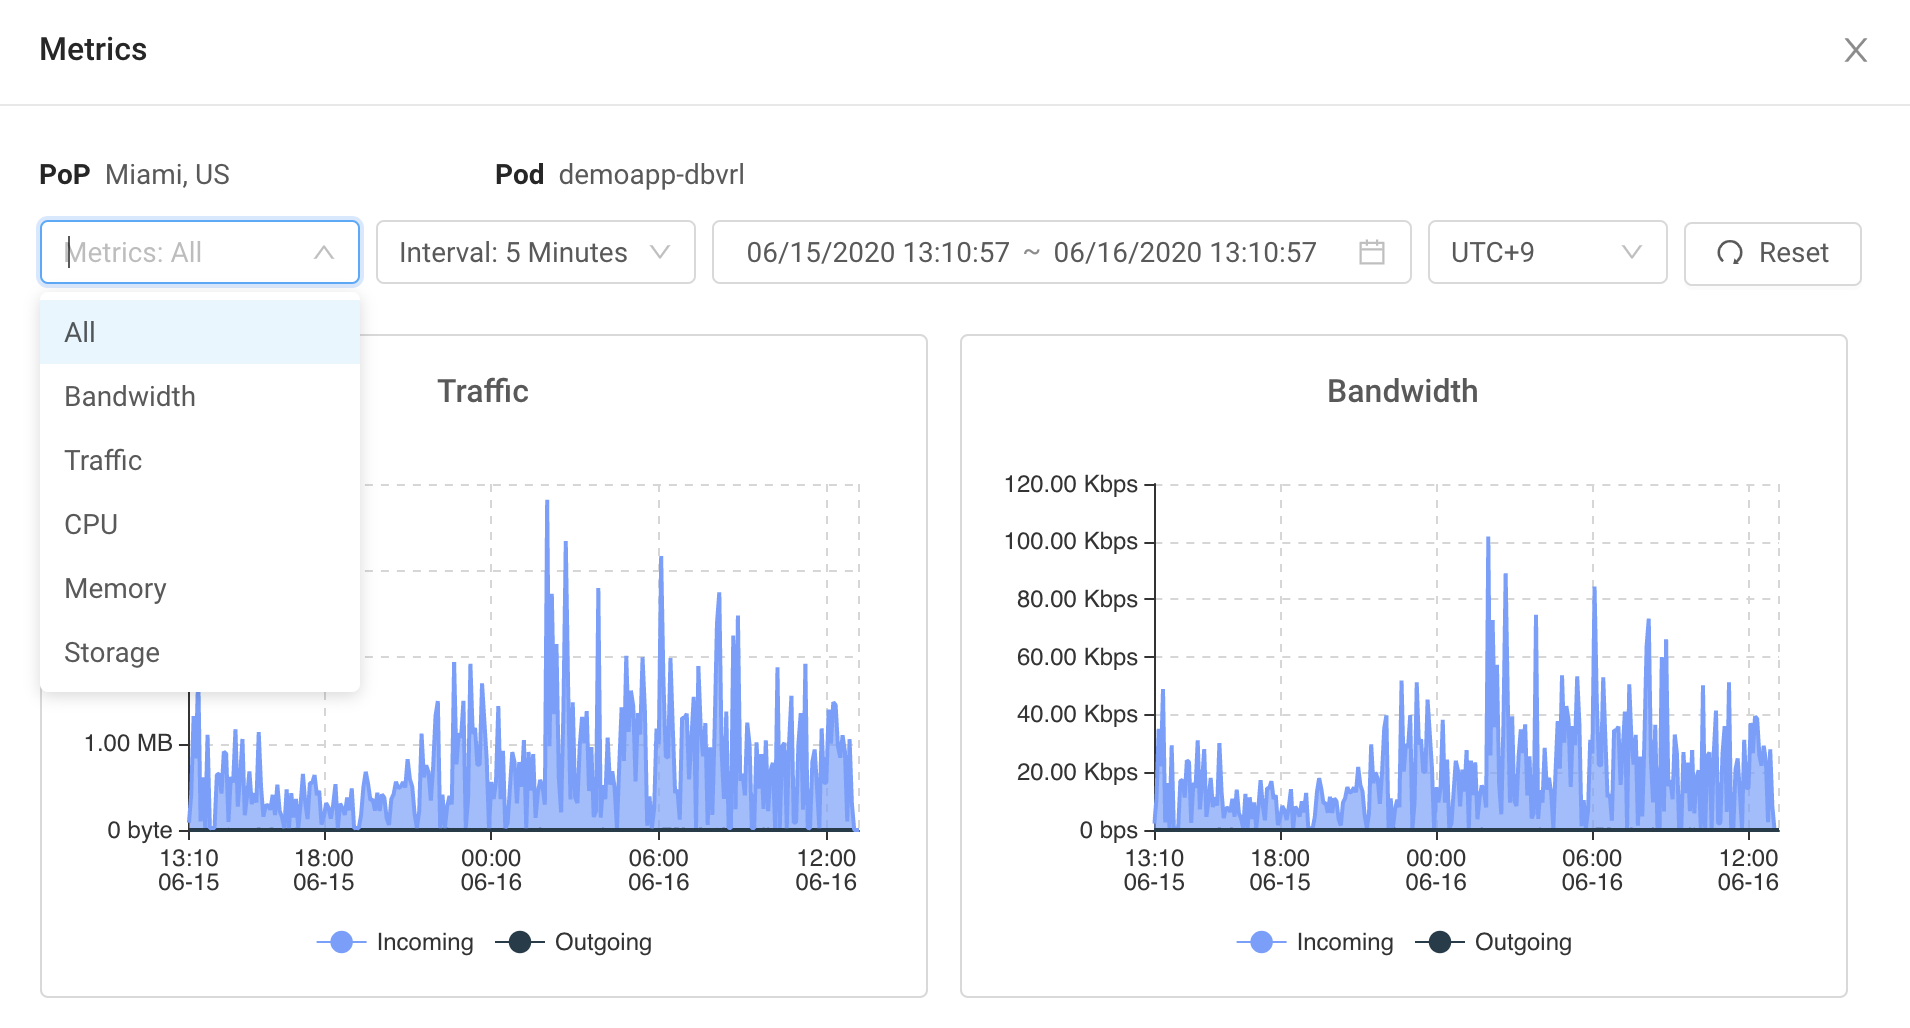
Go to the detail page of a specific application instance, click the top- right Metrics button, and retrieve metrics for the application instance, such as CPU and memory usage, traffic volume, and so on.
