CDNetworks Documentation
Understanding the Dashboard
The Dashboard is the landing page after you log in to the ECP. It provides an overview of resource quotas status and resource usage metrics.
When you subscribe to the ECP, restrictions are enforced on the total amounts of resources that can be requested across all ECP PoPs. These restrictions (called "resource quotas") ensure that at any time your cumulative resource requests do not exceed the limits. Resource quotas are consumed by your applications. Every time an application requests some resources, the request is checked against the resource quotas. If any incoming resource request causes the cumulative resource requests to exceed the quotas, the request will be rejected.
The ECP platform provisions compute, storage, and network resources. The Dashboard page provides an overview of how your applications are using these resources.
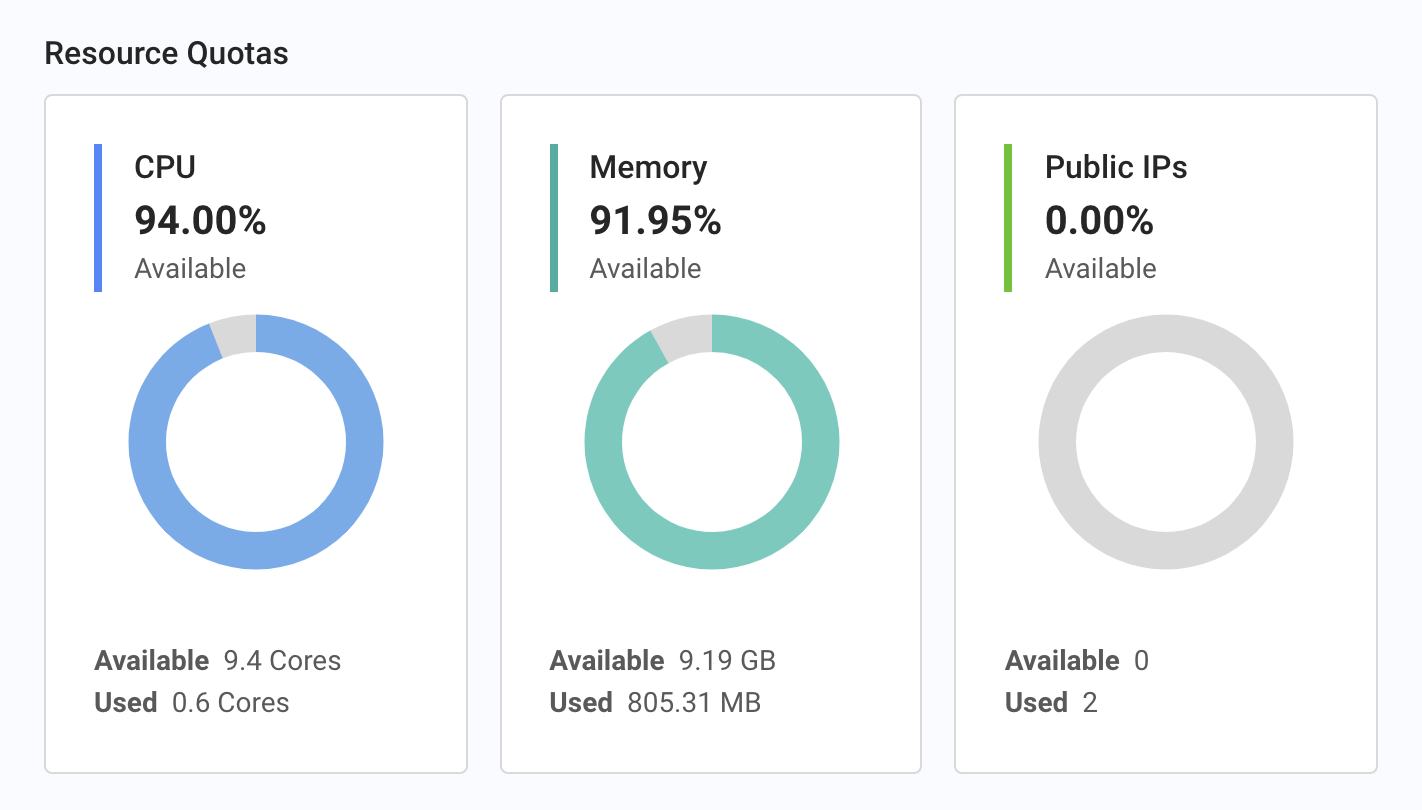
Resource quota charts at the top of the Dashboard show “quota consumed” and “quota available” percentages for quotas in CPU, memory, and public IPv4 addresses. In the backend, additional quotas are imposed, including:
- Number of applications
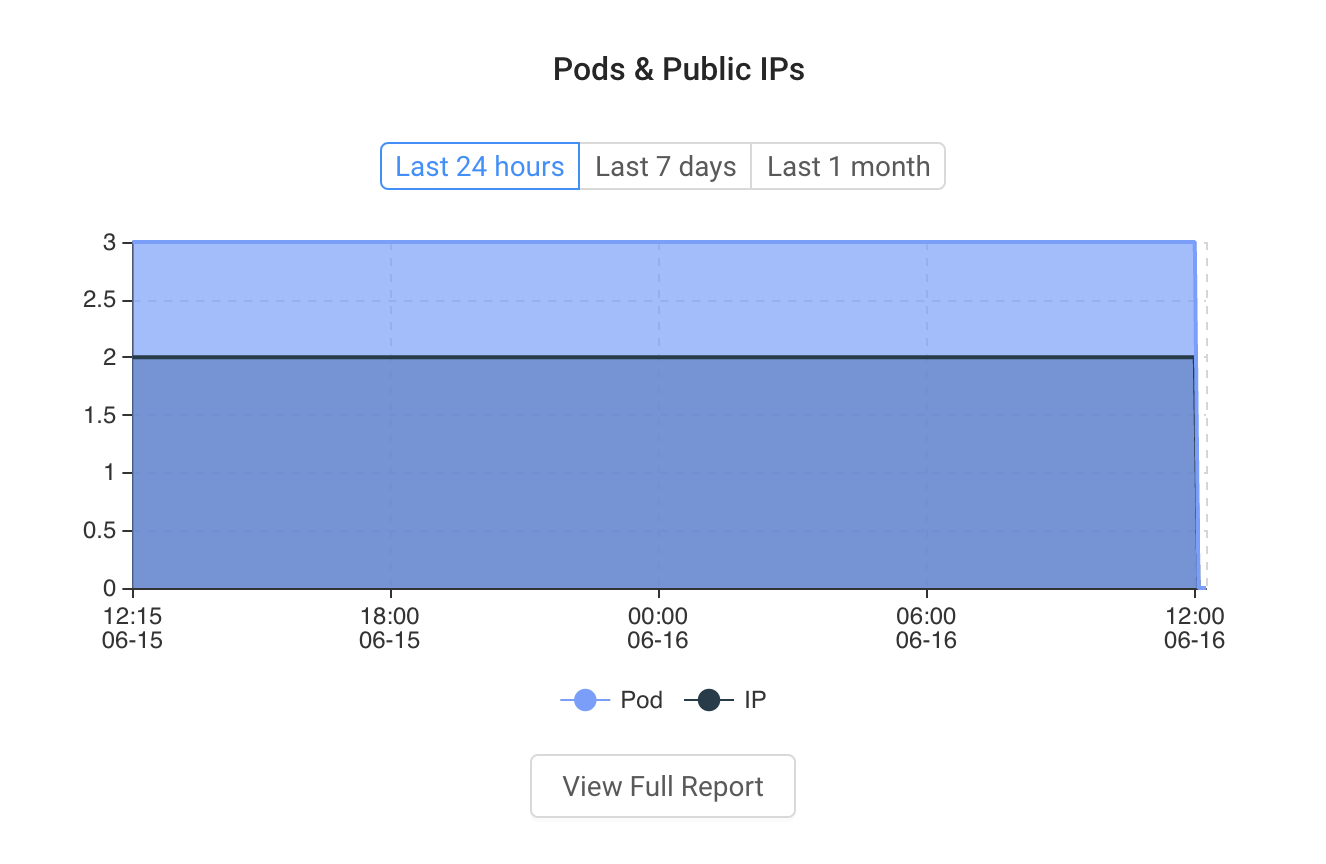
- Number of pods
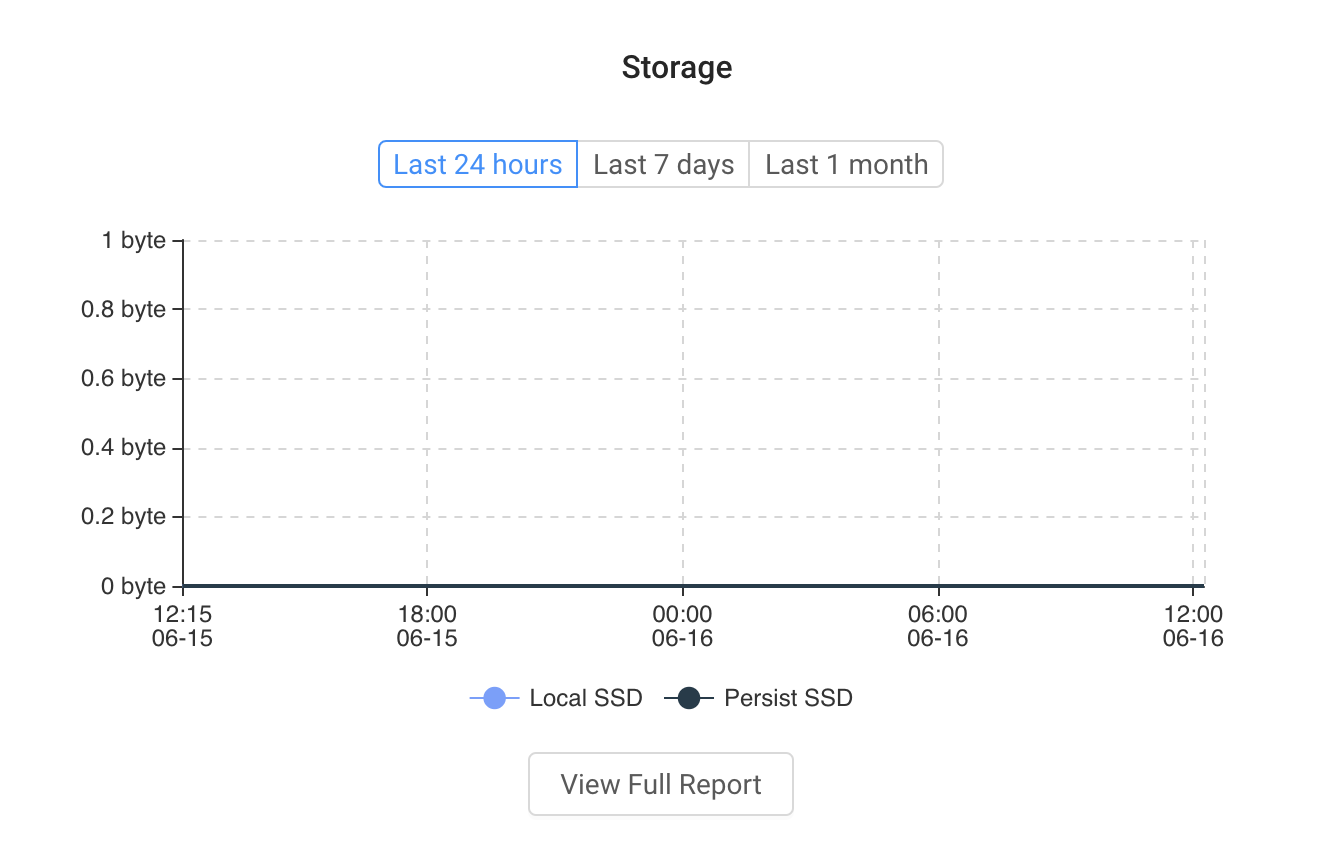
- Capacity of local-SSD storage
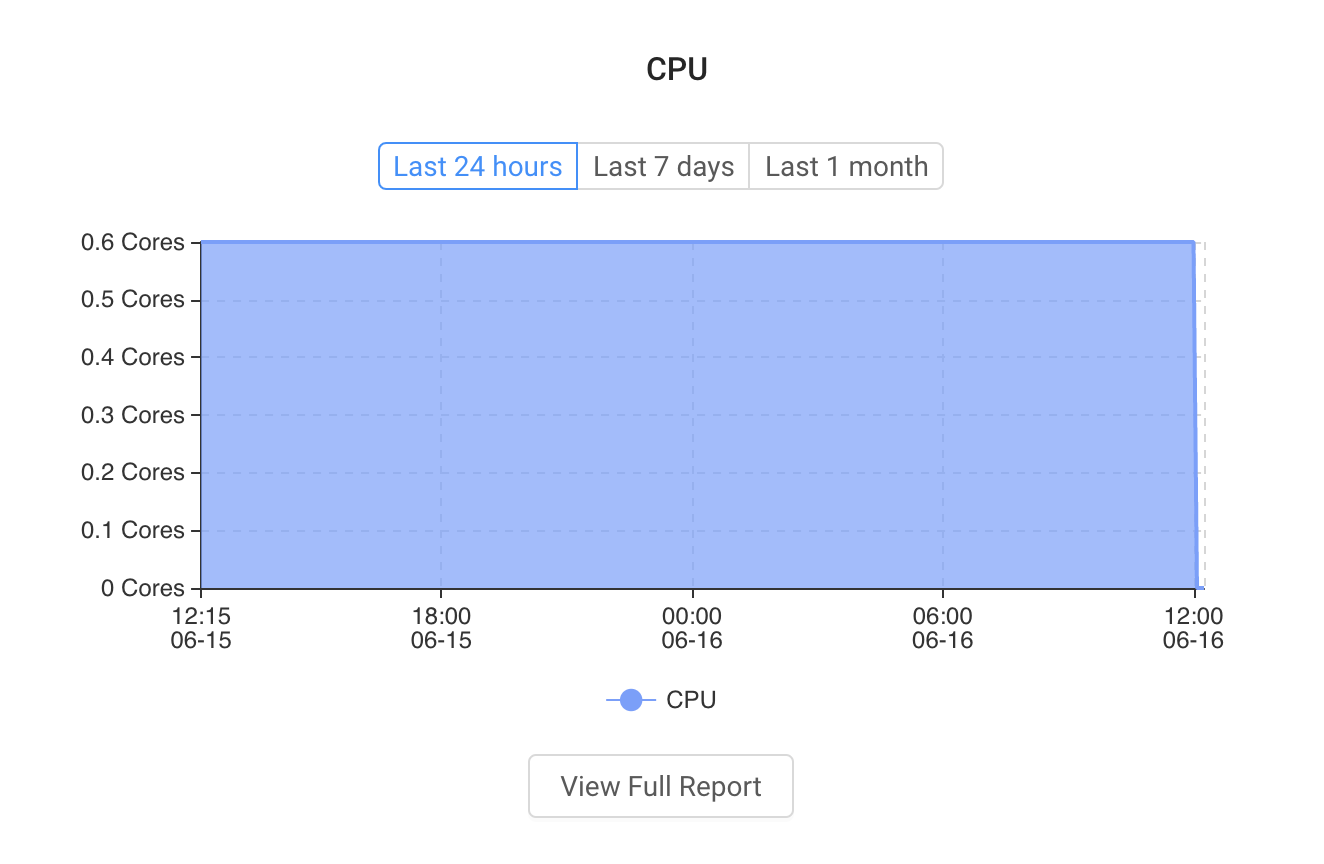
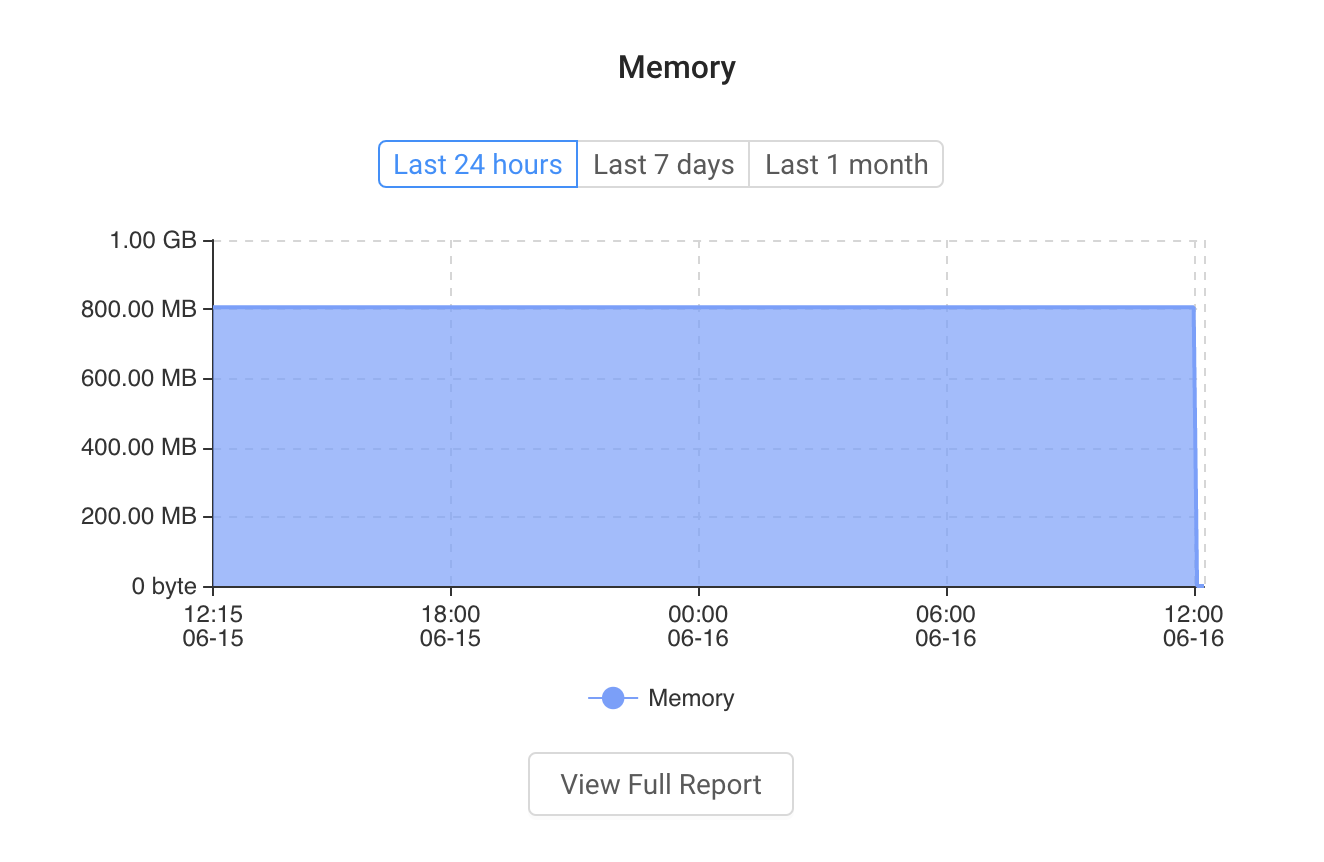
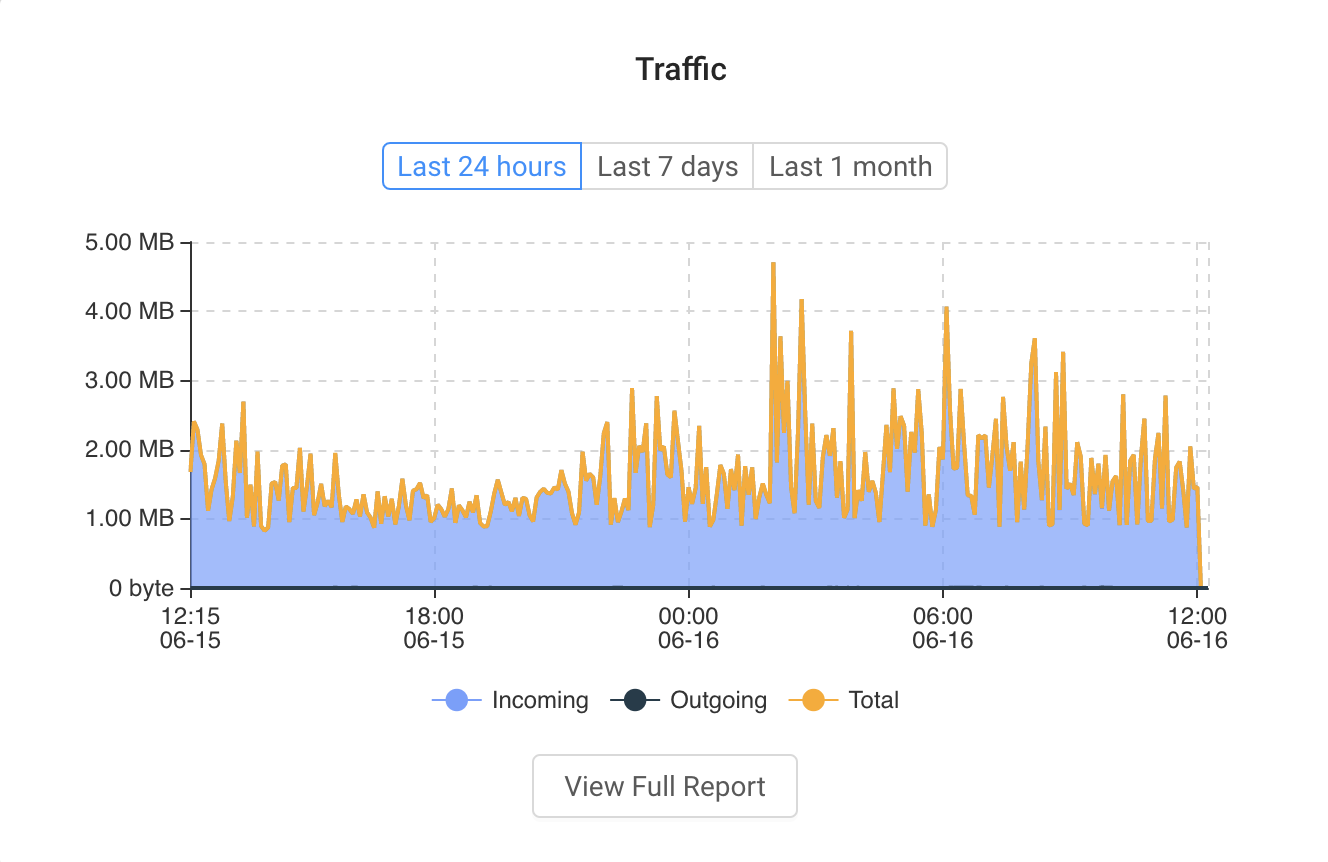
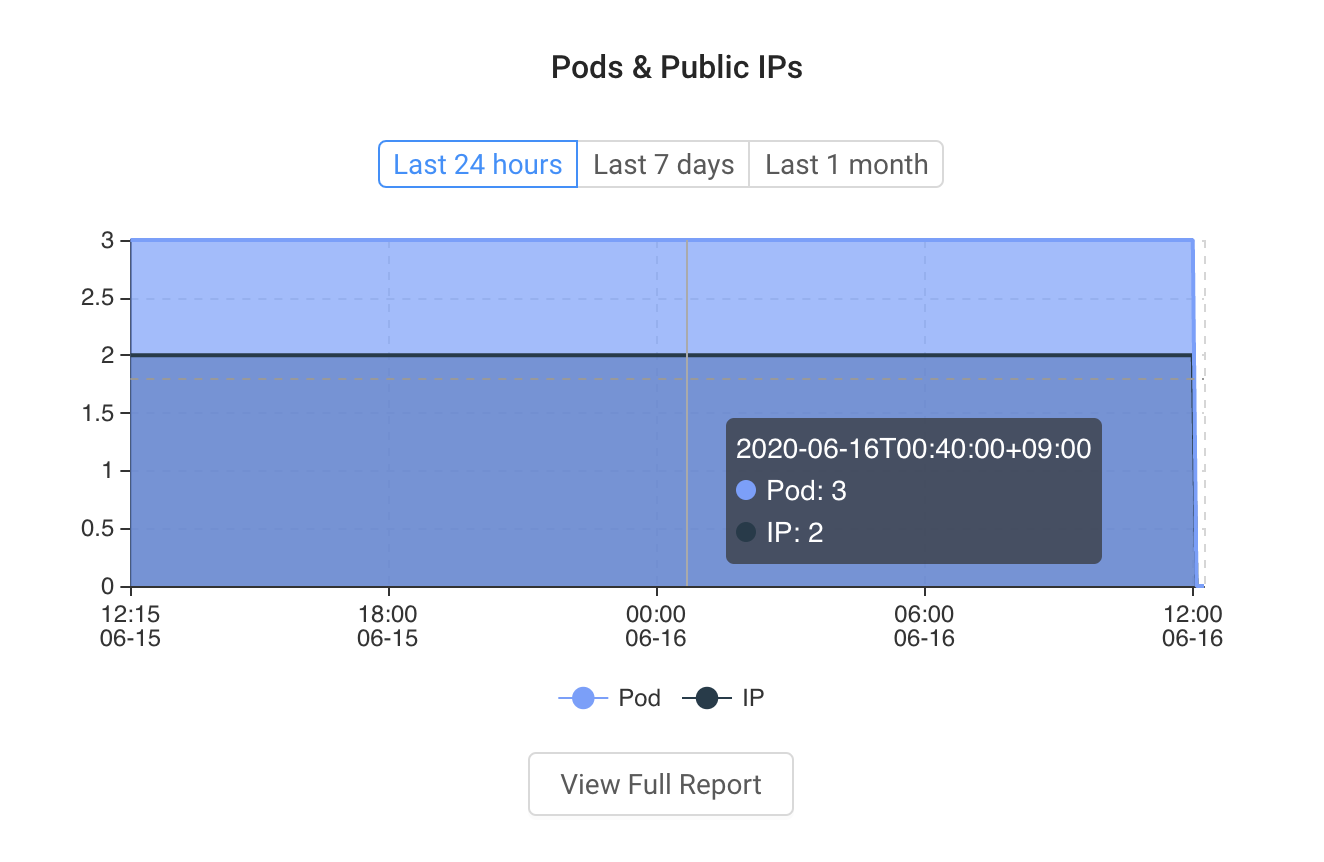
Charts at the bottom of the Dashboard show usage metrics. Buttons above the usage metrics charts allow you to filter the metrics by the last 24 hours (the default view), last 7 days, or last month. A legend below the usage metrics charts shows the names of the data entry points in the chart. Clicking a data entry point name in the legend removes that data entry point from the chart. Clicking it again redisplays the data entry point. Clicking View Full Report below a usage metrics chart displays that chart on the Reports page, where you can define report parameters, and then view the results on the selected chart.
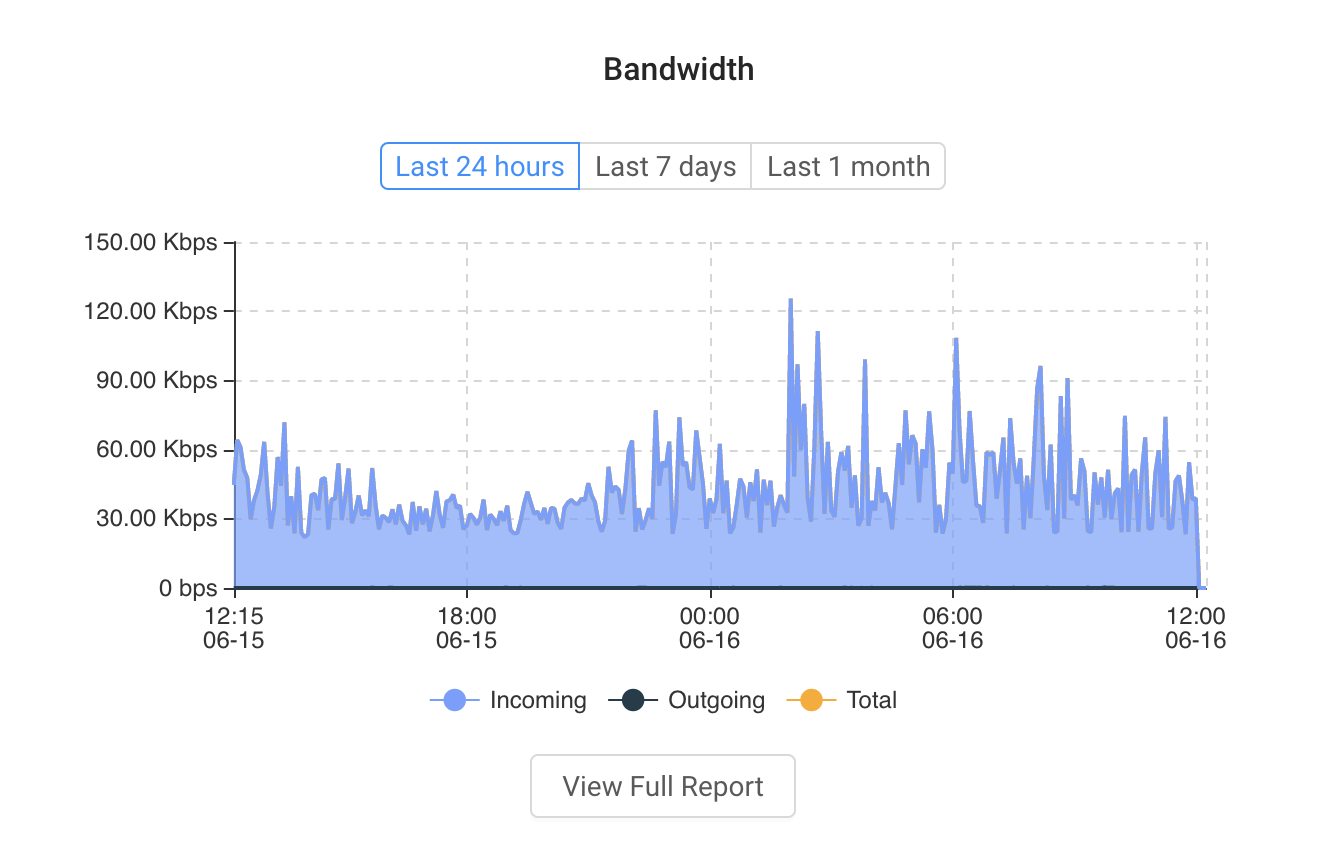
Hovering your cursor over the data points in a resource quota or usage metrics chart displays detailed information. For example:
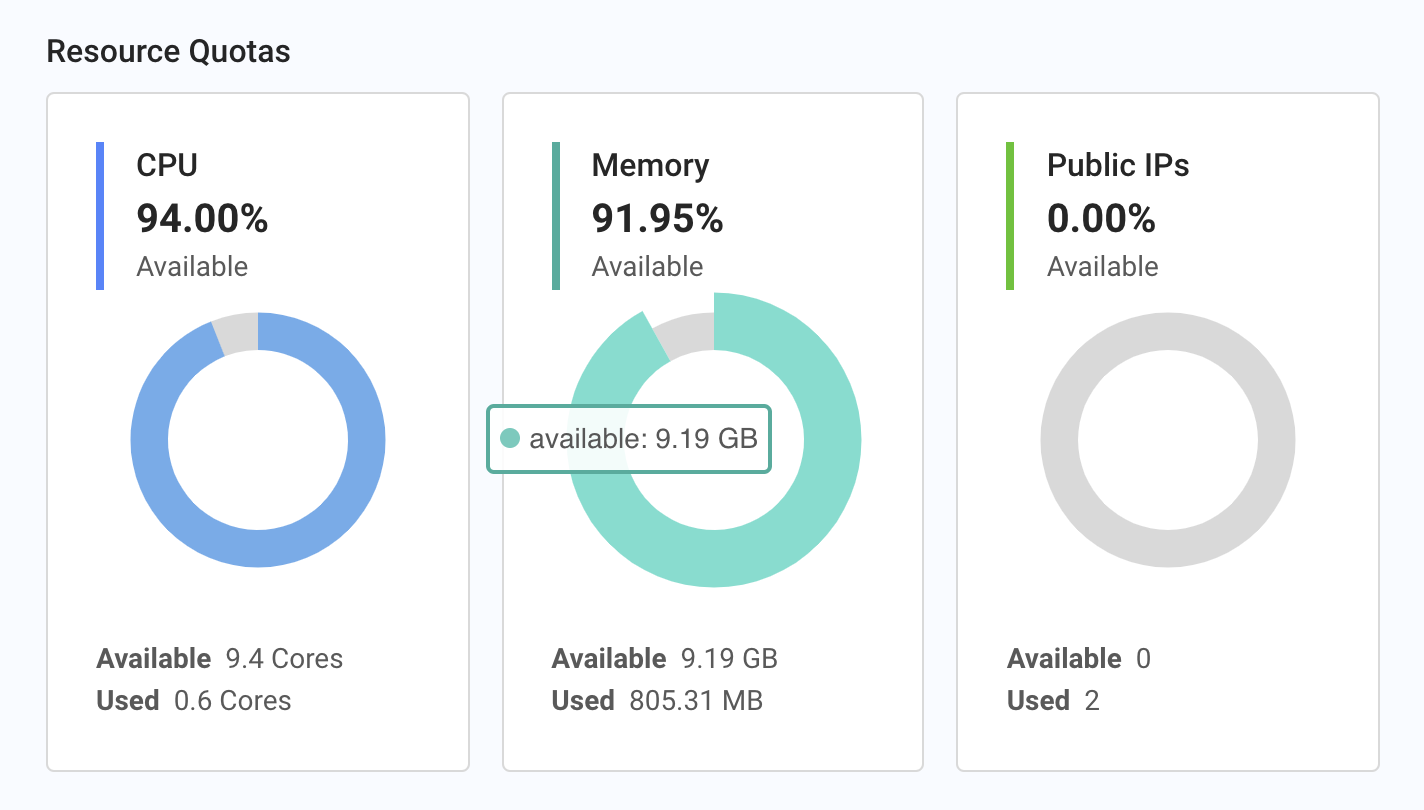
The metrics related to CPU, memory, and storage reflect your resource requests for your applications. These metrics do NOT mean the actual amounts of resource consumed by the processes running in your applications. For instance, if you request 1 vCPU core for your application when only 0.5 core is being used, the CPU metric value shown on the Dashboard will be the 1 vCPU core.
If you find on the portal or through an API call that high resource consumption is causing resource requests to be rejected, contact our sales engineers to adjust the quotas for your account. You will not incur higher costs by setting higher quotas. Billing is based on resources requested and allocated for your applications.