CDNetworks Documentation
Generating Reports
CDN Pro provides reporting capabilities that allow you to analyze the traffic to your properties, identify trends over time, and pinpoint times when visitors are most likely to land on your site.
Reports are generated from the Reports page. To display this page, click Reports > Charts in the left pane.
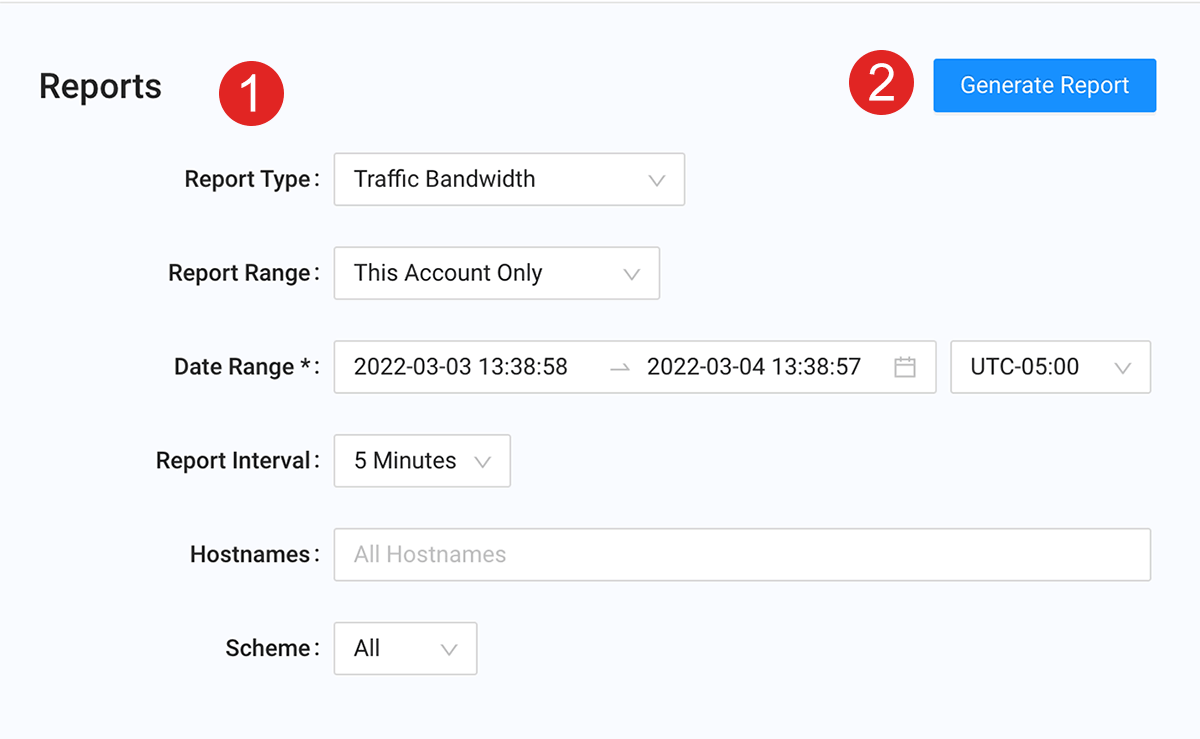
The following figure shows the key elements on the page, and the table following the figure describes them.
| Fields | Description |
|---|---|
| 1 | Specify the report type, date range, and other parameters appropriate for the report you want to generate. |
| 2 | The Generate Report button allows you to generate the report defined by the report parameters. |
Supported Report Types
The following report types are supported:
| Report | Description |
|---|---|
| Traffic Volume | Reports edge versus origin traffic. |
| Traffic Bandwidth | Reports edge versus origin traffic bandwidth. Lines represent edge traffic from CDN Pro servers, traffic from your origin servers, and cache hit rate. The vertical (Y) axis shows the bandwidth and hit ratio, while the horizontal (X) axis shows time. The cache hit rate is computed as (edge traffic - origin traffic) / edge traffic. |
| Requests | Reports requests made to the files of your property. Lines show the requests to CDN Pro edge servers, requests to your origin servers, and cache hit rate. The cache hit rate is computed as (edge requests - origin requests)/edge requests. |
| Status Code Details | Reports the percentage of HTTP status codes returned. For example, code 200 represents a successful request. |
| Origin Status Code Details | Reports the percentage of HTTP status codes returned in requests to your origin servers. For example, code 200 represents a successful request. |
| Fast Route Traffic Volume | Reports the traffic to your origin server that use CDNetworks' fast route feature to make connections faster and more reliable. |
| Fast Route Requests | Reports the number of requests to your origin server that uses CDNetworks' fast route feature to make connections faster and more reliable. |
| CPU Time | Reports the CPU time consumed in each time interval to serve your properties. You can toggle the unit between seconds and number of cores. For example, if 3000 seconds of CPU time are reported in a 5-minute interval, it means your properties are maxing out an average of 10 (=3000s/5m) physical CPU cores during that period. |
| Edge Hostname Request | Shows the number of requests made to your edge hostnames over a period of time. |
| Traffic Volume Summary | Summarizes the edge traffic volume. Mousing over slices in the pie chart shows detailed information about traffic volume. |
| Request Summary | Summarizes all requests by group, including edge requests and fast route requests. Mousing over slices in the pie charts shows detailed information about the requests. |
| CPU Time Summary | Summarizes the CPU time by group, including total edge CPU time and total intermediate CPU time. Mousing over slices in the pie charts shows detailed information about CPU times. |
Note: The selections you choose for the Traffic Volume Summary, Request Summary, or CPU Time Summary report persist as you switch among these three reports using the Report Type dropdown.
Generating Reports
- In the left pane, click Reports, and then select Charts.
- Complete the fields in the Reports page.
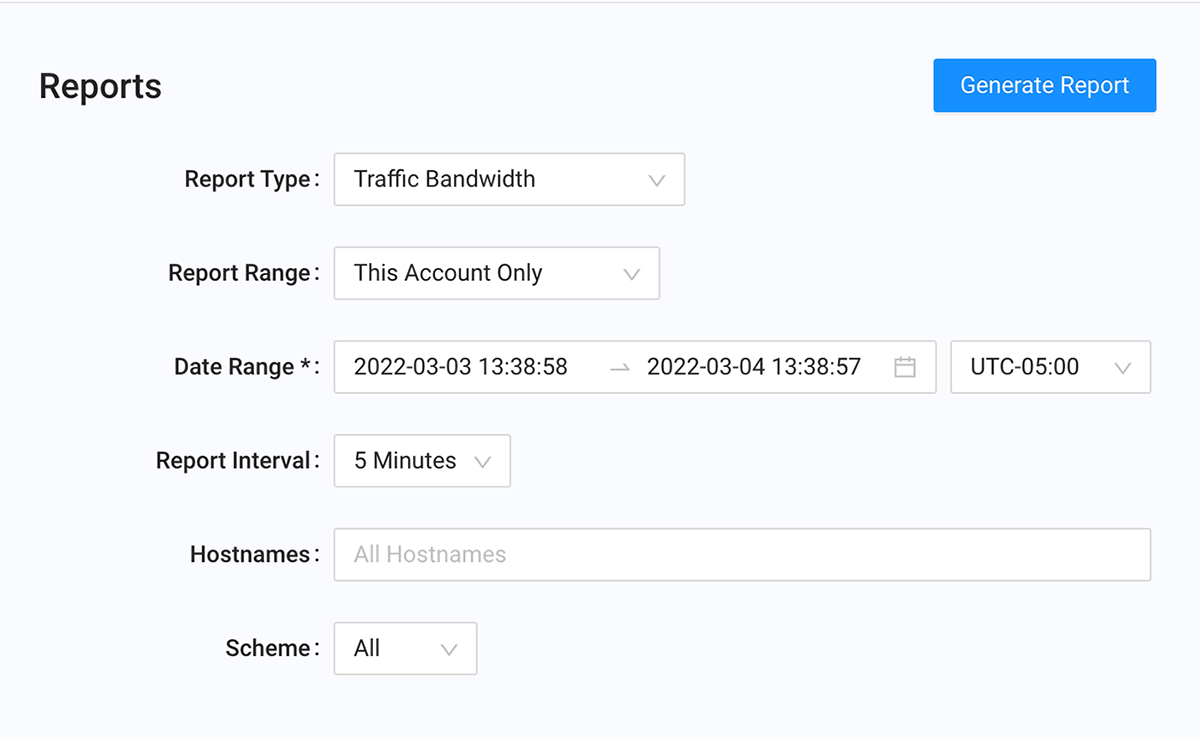
| Fields | Description |
|---|---|
| Report Type | Select the type of report you want to generate. |
| Report Range | If you are a reseller with child accounts, select the account that this report will cover. |
| Date Range | Select the start and end dates and the time for the report. |
| Report Interval | For all reports except Traffic Volume Summary, select the granularity of the returned data. |
| Hostnames | For all reports except Edge Hostname Request, select one or more hostnames defined in your properties. Tip: If you select two or more hostnames, you can save them as a group by clicking +Save selected hostnames as a group at the bottom of the dropdown list. The next time you want to use the same hostnames, just select the group instead of selecting the hostnames individually. A down arrow next to Groups at the top of the dropdown list allows you to export the groups to a CSV file. |
| Edge Hostnames | For Edge Hostname Request, select one or more edge hostnames. |
| Scheme | For all reports except Edge Hostname Request, select the protocol-based data traffic that will be reported. |
| Server Groups | All reports except for the Edge Hostname Request report support filtering by server groups. By default, data from all server groups is included. To choose specific server groups, select them from the available choices. |
| Group By | If Report Type is set to Traffic Volume Summary, Request Summary, or CPU Time Summary, use this field to group the results according to one or two of the following choices. |
- Click the Generate Report button to generate the report.
- After the report is generated, you can:
- Mouse over data points in the report to view detailed information.
- Drag over the chart to magnify areas, and then use the Reset zoom button to return to the default zoom level.
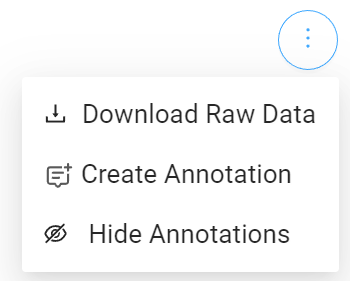
- Use the three vertical buttons at the top right of the report to download raw data in comma-separated-value (CSV) format, create annotations (described below), or hide annotations.
- Get traffic within a time range of a traffic volume report by using the "Traffic Within Time Range" fields below the chart.
Creating Annotations
After you generate a report, you can create text annotations to highlight events related to traffic going to your hostnames.
-
Click the three vertical buttons at the top right of the report and select Create Annotation.
-
Complete the fields in the Create an annotation dialog box.
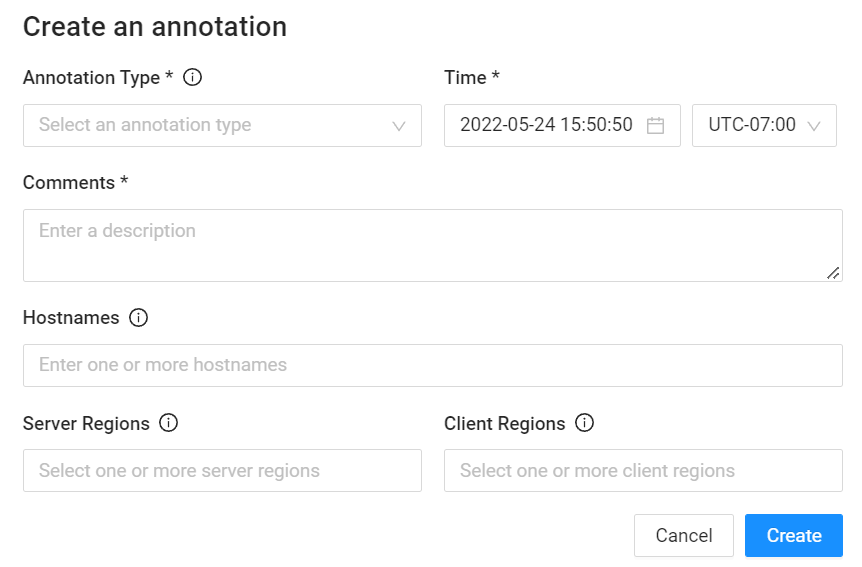
| Fields | Description |
|---|---|
| Annotation Type | Select the type of annotation you want to add.
|
| Time | Select an RFC 3339 date indicating when the annotation applies. |
| Comments | Enter a description about the event. The comments will appear in the report. |
| Hostnames | Select one or more hostnames. You can use wildcard domains such as *.abc.com, *.com, or *. If left blank, the annotation will apply to all hostnames. |
| Server Regions | Select one or more CDN Pro server regions affected by the event. |
| Client Regions | Select one or more end-user regions affected by the event. |
- Click Create.
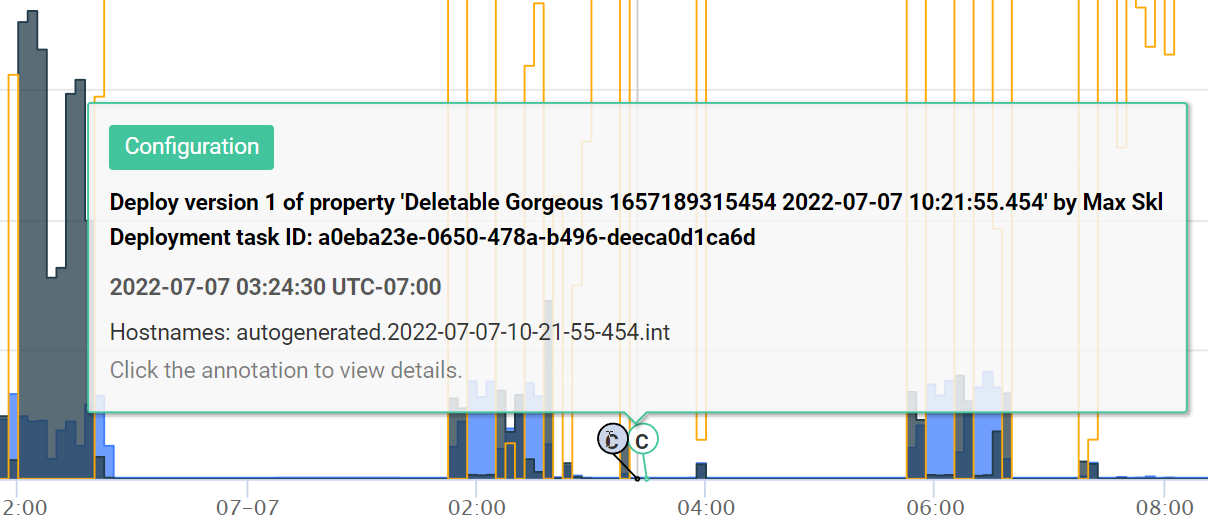
After you create annotations, you can hide them or redisplay them by clicking the three vertical buttons at the top right of the report and selecting Hide Annotations or Show Annotations.
The following figure shows an example of two annotations.